Search for another article…

Site Diagnostics can be used to enable web site logging, view detailed errors, and also provide debug information for your application.
-
After logging into your control panel click on CloudSites and choose the site you want to configure site diagnostics for.
-
Click on the Config button and scroll down to the section titled Site Diagnostics.
-
Here you have three options. Note, log files are stored in the file system of your application and count against your disk space. Make sure to only enable these options when necessary. If you do keep these options on please make sure to periodically clean out old files.
- Web Server Logging: Enable simple IIS web logging. The raw log files from the web server will be saved to your account under the logging folder. These log files can be used with programs to analyze traffic to your site, track bandwidth, etc.
- Detailed Error Messages: Creates detailed versions of the html files produced when your website responds with an error message. This is good to enable for debugging some error responses in your website.
- Failed Request Tracing: Request-based tracing that can be used to debug performance issues or errors in your website or application. This is commonly used with visual studio to get to the bottom of application issues. Note, this is a debugging feature that should only be used when troubleshooting.
- To enable an option click the On button next to the feature you wish to enable then scroll down and click the save button. Log files will now be created and can be accessed through FTP.
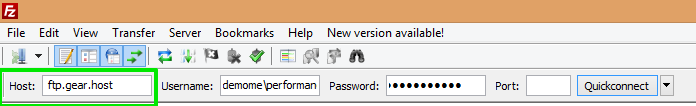
- Open FileZilla and in the quick connect bar enter the server, user name, and password. Remember you can find the information on the Overview page of your CloudSite in your control panel.
-
Click Quickconnect and you will be connected to the FTP server.
-
Log files can be found in the LogFiles folder.
-
Inside the LogFiles folder there are sub folders containing the actual log files themselves.
- DetailedErrors: These are the html files created when you enabled the Detailed Error Messages option under Site Diagnostics.
- http: These are the raw log files produced by IIS for every request coming to your site or application by enabling the Web Server Logging option under Site Diagnostics.
- W3SVC*****: This directory contains the failed request tracing log files if you have that option turned on in site diagnostics.
Contribute to this article
Want to edit or suggest changes to this content? You can edit and submit changes to this article using GitHub.